Brian Fremeau scores a game of football in a way that is more insightful than the scoreboard, and every fan should know about it.
My guess is you have never heard of this; I only stumbled upon it recently. When I figured out what he was saying, I realized that I had spent almost 40 years playing, coaching, watching, and analyzing football relying on box scores and scoreboards that inadequately describe the game. And I know I have not been alone. Football broadcasters express superlatives with "stats" that are half-truths. Fans use them to celebrate every win and seek blame in every loss, often lionizing or condemning the wrong part of their team.
Let's start from the beginning
Here is my understanding of how I got there: the first football game I remember is Super Bowl XVII, after the 1982 season. The hazy image still left is Miami returning a second-quarter kickoff 98 yards. I know the Redskins won the game; I can’t recall if I cared.
The next season was different. I took a liking to the Raiders during the AFC playoffs and was glad when they reached the Super Bowl. The game was the turning point. The Raiders dismantled Washington. Marcus Allen reversed field and ran 74 yards for a touchdown. Their surly defense smothered Joe Theismann and John Riggins.
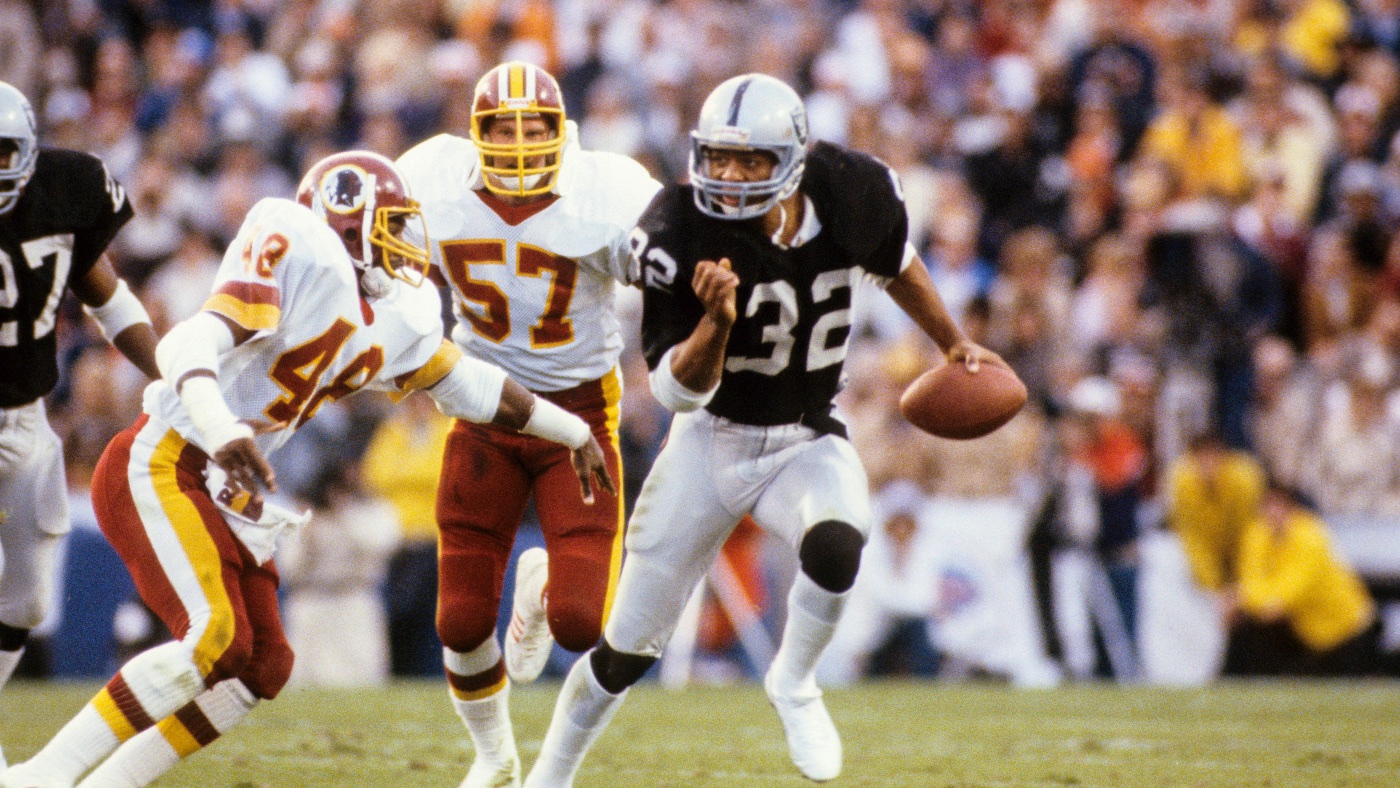
I was hooked. Football thrilled me—the speed and the violence. I got a Raiders jersey and helmet for Christmas. For my seventh birthday, all I wanted to do was play football in the front yard. When my friends did not take the game seriously enough, I had a meltdown.
The other education
In seventh grade, I finally got to play in a “real” football game. At the time, it felt like a turning point in my life. I was old enough to hit. The same year marked a different kind of shift. My progressive middle school offered an elective called “Fantasy Baseball.” We drafted players and calculated their points in class. If the teacher’s plan was to trick boys into caring about math, it worked. I started reading every box score I could find, looking for patterns.
What gets counted, counts
I did not know it at the time, but understanding sports through numbers changed how I saw the game. I became less fixated on highlights and started trying to figure out why some teams were better than others. But it had a subtler negative effect. In business they say "what gets measured gets managed." The sports-fan equivalent is "what gets measured, gets valued." We see this perhaps most clearly in voting for the NBA MVP. The top scorer or top scorer on the team with the most wins gets the most votes. What gets counted counts. Lies, damn lies, and statistics.
How we quantify football shapes how we talk about the game. Football is at least two games in one—two offenses against two defenses. We look at the final score and make judgments about the result of these two matchups. Points scored belong to the offense. Points allowed belong to the defense. We make this inference at the game level and season level. We do it unconsciously.
A game to illustrate the problem with the final score: Oregon 23, Texas Tech 0.
Consider Oregon’s 23–0 playoff win over Texas Tech in the 2025 season. A normal read is that Oregon’s defense won its matchup decisively, holding Texas Tech to zero points. Its offense must have done pretty well, too: scoring 23 points is respectable against elite competition.
What Fremeau's ratings see instead.
Brian Fremeau publishes the FEI ratings at BCF Toys. I had been looking at those ratings for years before I understood the possession-by-possession accounting underneath them. His Game Splits page exposes that intermediate layer: it shows what each unit contributed in each game. The season ratings then aggregate those possessions and adjust them for opponent.
What the score missed
Oregon’s defense created more than 23 points of margin.
On the Game Splits page, the Cotton Bowl line tells a more extreme story than the shutout: Oregon’s defense added 36.1 points of margin, the offense gave back 18.3, special teams added 3.2, and Oregon’s extra possession added 1.9. The chart puts that claim next to the scoreboard.
 Oregon 23−
 Texas Tech 0=+23 margin value
The displayed columns are rounded to tenths. BCF’s underlying values reconcile to the 23-point margin.
The split divides the game’s 23-point margin among the three matchups inside it rather than simply awarding the points scored: Oregon’s offense against Texas Tech’s defense, Texas Tech’s offense against Oregon’s defense, and the two special-teams units. Because Oregon had one more counted possession, that opportunity receives a separate line.
Add the four values and they reconcile to 23 after rounding. Having watched the game, that division feels right. The next question is how a defense can create 36.1 points of margin in a game it won by 23. The answer begins with where each possession started.
Scoring the matchups
How do we score football’s matchups without relying on the scoreboard?
The key is to judge each unit in the context of the situation it faced. In football, the number of points scored depends in part on where a possession starts. A drive beginning at the opponent’s 29 is not the same assignment as a drive beginning at your own 2.
Fremeau’s accounting begins there. Using data from many games, he estimates how many points an average offense scores from each starting field position. The chart below shows those values.
- 1.00Own 1
- 1.93Own 25 · baseline
- 2.97Midfield
- 4.71Opponent 20
- 6.47Opponent 1
Five exact starting positions from Fremeau’s public possession splits. The 1.93 own-25 baseline appears again as +1.9 EV in the rounded 2025 Oregon–Texas Tech row.
With that information, Fremeau can assign credit—or margin value—to each unit on every possession. If the offense scores more than the average for its starting field position, the offense gets credit and the opposing defense receives the matching debit.
The offense either converts its opportunity into scoring value or gives some of it back. The defense does the same from the other side of the ball. Field goals, punts, kickoffs, and point-after attempts receive their own debits and credits. If one team receives an extra possession, the baseline value of that possession is recorded separately.
I think expected margin value is a useful name for what moves through this system: the expected effect of the current field position on scoring margin. But the final game split is not merely expected. Fremeau reconciles the values to the margin that was actually scored on non-garbage possessions.
Diving deep into the mechanics of credit assignment
From field-position expectation to assigned value
Understanding the field-position curve gives us the intuition behind how Fremeau’s Game Splits score each possession. But how exactly does it all work and fit together? To fully appreciate his Game Splits, we also need to understand the meaning of the key acronyms in the splits: NM, OD, DD, OX, DX, FG, P, K, XP, and EV. Throughout, we will stick to our Oregon–Texas Tech game, with numbers expressed from Oregon’s perspective.
First, the final margin.
NM is simply the margin of victory, excluding “garbage” possessions. For Oregon in this game, that is both the final margin and the non-garbage margin: 23–0, or +23. There were no garbage-time points in this game, so we do not need to worry about what it means at the moment. It is important for understanding true team strength, but not in this game.
Why it is useful: Every credit and debit that follows must add back to the same competitive margin.
Next, judge what happened during each drive.
The D stands for drive. OD asks what the offense produced compared with the value it inherited. It is the difference between the expected field-position value and the points actually scored by the offense. Oregon scored 23 points, but it needed 13 counted drives and repeatedly inherited valuable field position. Relative to its assignments, the offense’s drives totaled −12.6 OD.
DD asks the same question of the defense. Texas Tech had 12 counted drives and scored zero points. Oregon’s defense thus earned +18.4 DD by extinguishing the scoring value Texas Tech carried into those possessions.
Why they are useful: OD and DD judge what a unit did with its assignment without pretending every drive began in the same place.
Then ask who created the next field position.
The X stands for the exchange between possessions. Oregon’s defense did more than keep Texas Tech off the scoreboard. Four takeaways and three fourth-down stops kept handing the offense another opportunity, often on a short field. That exchange value belongs to the defense.
OX records the offense’s side of those exchanges. Oregon’s three failed fourth downs and interception left a −5.7 OX debit. The defense’s takeaways and stops produced +17.7 DX.
Why they are useful: OX and DX keep turnovers and fourth-down stops from becoming invisible prefaces to somebody else’s points.
Give special teams credit for the field position and points it creates.
Field goals (FG), punts (P), kickoffs (K), and point-after plays (XP) move the same value. Oregon made field goals from 50, 39, and 43 yards; Texas Tech missed from 54. Add punt, kickoff, and point-after value and Oregon’s special teams contributed +3.2.
Why they are useful: A punt that flips the field and a return that creates a short field are no longer treated as empty space between offensive drives.
Finally, account for an extra possession if one exists.
Every normal possession starts with the 1.93-point own-25 baseline. Because every number is shown from Oregon’s point of view, each Oregon possession starts with +1.93 and each Texas Tech possession starts with −1.93. Oregon had 13 counted offensive possessions to Texas Tech’s 12, leaving one unmatched +1.93 baseline as EV.
Why it is useful: The advantage of simply having one more opportunity does not disappear or get assigned to the wrong unit.
Now the unit totals mean something.
OV combines OD and OX. DV combines DD and DX.SV combines the four special-teams columns. Add them with EV and the game balances: −18.3 offense + 36.1 defense + 3.2 special teams + 1.9 EV = 22.9 after the published columns are rounded, and +23 underneath them.
The accounting check
Oregon’s credit is Texas Tech’s debit.
Each unit value has an equal and opposite entry for the opponent. This is why the split can assign credit without inventing extra points.
OD and DD describe opposite sides of the same offensive drives. OX and DX do the same for stops and change-of-possession events. The grouped totals use unrounded values; displayed subcolumns can miss the grouped total by a tenth because each is shown to one decimal.
The game, possession by possession
How 25 possessions became +23.
To really understand how this all works, it’s helpful to see each value change, possession by possession. The chart below traces BCF’s 25 counted possessions—13 Oregon drives and 12 Texas Tech drives—through the 23–0 score. Each line moves from starting field position to result and estimates how the published unit totals accumulated. It is a bit much; read as much or as little as you need.
Start with the first possession. Pay attention to where the drive started and the three components of value: OD, FG, and EV. What this says is that the three points scored by Oregon were created by having the possession itself (+1.93), the 50-yard field goal (+0.60), and just +0.47 from the offensive drive.
Follow that same handoff through the game and the totals stop looking mysterious. Oregon’s defense repeatedly ended a Texas Tech drive and delivered another opportunity. Oregon’s offense repeatedly gave part of that value back.
BCF publishes the exact 2025 game totals, but not the old possession-level value table. The card values below are estimates reconstructed from the official play-by-play and constrained to reconcile exactly to BCF’s published totals. They are transparent estimates, not additional values published by Fremeau.
The bold text is the starting field position. “ORE 25” means Oregon started from its own 25-yard line, 75 yards from the Texas Tech goal. “TTU 29” on an Oregon card means Oregon started 29 yards from the end zone.
Every tag is Oregon’s estimated credit or debit on that line. Positive helped Oregon; negative helped Texas Tech. Add the tags to get the score-margin change shown at right. The estimates preserve BCF’s exact displayed totals.
After every possession, the tally updates the score and four running totals. As explained above, drive net (OD + DD) shows what happened during the drives. Exchange net (OX + DX) shows the value in field position or score created via a change of possession—a turnover on downs or another turnover. The special-teams total combines field goals, punts, kickoffs, and extra points. EV tracks whether one team received an extra possession. The baselines cancel until Oregon’s unmatched 13th possession leaves +1.93 behind.
First halfOregon 6 · Texas Tech 0
- 13–0Oregon · OffenseField goalStarting field positionORE 25Oregon’s own 25 · 75 yards to the Texas Tech goal10 plays · 43 yards
Atticus Sappington makes from 50 yards
Estimated Oregon value on this line+3.00- OD+0.47
- FG+0.60
- EV+1.93
Running tally after this possession- Score
- 3–0 ORE–TTU
- OD + DD
- +0.5 Drive net
- OX + DX
- 0.0 Exchange net
- SP
- +0.6 Special teams
- EV
- +1.9 Extra possession
- Texas Tech · OffensePuntStarting field positionTTU 25Texas Tech’s own 25 · 75 yards to the Oregon goal3 plays · 8 yardsEstimated Oregon value on this line0.00
- DD+1.93
- EV−1.93
Running tally after this possession- Score
- 3–0 ORE–TTU
- OD + DD
- +2.4 Drive net
- OX + DX
- 0.0 Exchange net
- SP
- +0.6 Special teams
- EV
- 0.0 Extra possession
23–0 - 33–0Oregon · OffenseDownsStarting field positionORE 28Oregon’s own 28 · 72 yards to the Texas Tech goal13 plays · 47 yards
Texas Tech stops Oregon at the 25
Estimated Oregon value on this line0.00- OD−2.01
- P+0.08
- EV+1.93
Running tally after this possession- Score
- 3–0 ORE–TTU
- OD + DD
- +0.4 Drive net
- OX + DX
- 0.0 Exchange net
- SP
- +0.7 Special teams
- EV
- +1.9 Extra possession
- Texas Tech · OffensePuntStarting field positionTTU 25Texas Tech’s own 25 · 75 yards to the Oregon goal3 plays · −10 yardsEstimated Oregon value on this line0.00
- DD+3.03
- OX−1.10
- EV−1.93
Running tally after this possession- Score
- 3–0 ORE–TTU
- OD + DD
- +3.4 Drive net
- OX + DX
- −1.1 Exchange net
- SP
- +0.7 Special teams
- EV
- 0.0 Extra possession
43–0 - 53–0Oregon · OffensePuntStarting field positionORE 35Oregon’s own 35 · 65 yards to the Texas Tech goal3 plays · 4 yardsEstimated Oregon value on this line0.00
- OD−2.11
- P+0.18
- EV+1.93
Running tally after this possession- Score
- 3–0 ORE–TTU
- OD + DD
- +1.3 Drive net
- OX + DX
- −1.1 Exchange net
- SP
- +0.9 Special teams
- EV
- +1.9 Extra possession
- Texas Tech · OffenseInterceptionStarting field positionTTU 22Texas Tech’s own 22 · 78 yards to the Oregon goal2 plays · 3 yards
Oregon takes over at the Texas Tech 33
Estimated Oregon value on this line0.00- DD+0.33
- DX+1.50
- P+0.10
- EV−1.93
Running tally after this possession- Score
- 3–0 ORE–TTU
- OD + DD
- +1.6 Drive net
- OX + DX
- +0.4 Exchange net
- SP
- +1.0 Special teams
- EV
- 0.0 Extra possession
63–0 - 73–0Oregon · OffensePuntStarting field positionTTU 33Texas Tech’s 33 · 33 yards to the end zone3 plays · −10 yardsEstimated Oregon value on this line0.00
- OD−3.13
- DX+1.20
- EV+1.93
Running tally after this possession- Score
- 3–0 ORE–TTU
- OD + DD
- −1.5 Drive net
- OX + DX
- +1.6 Exchange net
- SP
- +1.0 Special teams
- EV
- +1.9 Extra possession
- Texas Tech · OffenseMissed field goalStarting field positionTTU 10Texas Tech’s own 10 · 90 yards to the Oregon goal6 plays · 54 yards
Texas Tech misses from 54 yards
Estimated Oregon value on this line0.00- DD+1.36
- P+0.12
- FG+0.45
- EV−1.93
Running tally after this possession- Score
- 3–0 ORE–TTU
- OD + DD
- −0.1 Drive net
- OX + DX
- +1.6 Exchange net
- SP
- +1.5 Special teams
- EV
- 0.0 Extra possession
83–0 - 93–0Oregon · OffenseDownsStarting field positionORE 36Oregon’s own 36 · 64 yards to the Texas Tech goal14 plays · 62 yards
Texas Tech holds at its own 2
Estimated Oregon value on this line0.00- OD−1.93
- EV+1.93
Running tally after this possession- Score
- 3–0 ORE–TTU
- OD + DD
- −2.1 Drive net
- OX + DX
- +1.6 Exchange net
- SP
- +1.5 Special teams
- EV
- +1.9 Extra possession
- Texas Tech · OffenseFumbleStarting field positionTTU 2Texas Tech’s own 2 · 98 yards to the Oregon goal7 plays · 27 yards
Oregon recovers at the Texas Tech 29
Estimated Oregon value on this line0.00- DD−0.37
- DX+1.50
- OX+0.80
- EV−1.93
Running tally after this possession- Score
- 3–0 ORE–TTU
- OD + DD
- −2.4 Drive net
- OX + DX
- +3.9 Exchange net
- SP
- +1.5 Special teams
- EV
- 0.0 Extra possession
103–0 - 116–0Oregon · OffenseField goalStarting field positionTTU 29Texas Tech’s 29 · 29 yards to the end zone4 plays · 9 yards
Sappington makes from 39 yards
Estimated Oregon value on this line+3.00- OD−0.86
- DX+1.45
- FG+0.48
- EV+1.93
Running tally after this possession- Score
- 6–0 ORE–TTU
- OD + DD
- −3.3 Drive net
- OX + DX
- +5.3 Exchange net
- SP
- +2.0 Special teams
- EV
- +1.9 Extra possession
- Texas Tech · OffensePuntStarting field positionTTU 25Texas Tech’s own 25 · 75 yards to the Oregon goal3 plays · 6 yardsEstimated Oregon value on this line0.00
- DD+1.93
- EV−1.93
Running tally after this possession- Score
- 6–0 ORE–TTU
- OD + DD
- −1.4 Drive net
- OX + DX
- +5.3 Exchange net
- SP
- +2.0 Special teams
- EV
- 0.0 Extra possession
126–0 - 136–0Oregon · OffenseEnd of halfStarting field positionORE 22Oregon’s own 22 · 78 yards to the Texas Tech goal4 plays · 19 yardsEstimated Oregon value on this line0.00
- OD−1.88
- P−0.05
- EV+1.93
Running tally after this possession- Score
- 6–0 ORE–TTU
- OD + DD
- −3.2 Drive net
- OX + DX
- +5.3 Exchange net
- SP
- +2.0 Special teams
- EV
- +1.9 Extra possession
Second halfOregon 23 · Texas Tech 0
- Texas Tech · OffensePuntStarting field positionTTU 25Texas Tech’s own 25 · 75 yards to the Oregon goal3 plays · 2 yardsEstimated Oregon value on this line0.00
- DD+1.93
- EV−1.93
Running tally after this possession- Score
- 6–0 ORE–TTU
- OD + DD
- −1.3 Drive net
- OX + DX
- +5.3 Exchange net
- SP
- +2.0 Special teams
- EV
- 0.0 Extra possession
146–0 - 156–0Oregon · OffenseDownsStarting field positionTTU 41Texas Tech’s 41 · 41 yards to the end zone4 plays · 9 yards
Texas Tech stops Oregon at the 32
Estimated Oregon value on this line0.00- OD−2.28
- P+0.35
- EV+1.93
Running tally after this possession- Score
- 6–0 ORE–TTU
- OD + DD
- −3.6 Drive net
- OX + DX
- +5.3 Exchange net
- SP
- +2.3 Special teams
- EV
- +1.9 Extra possession
- Texas Tech · OffenseFumbleStarting field positionTTU 32Texas Tech’s own 32 · 68 yards to the Oregon goal3 plays · −26 yards
Oregon recovers at the Texas Tech 6
Estimated Oregon value on this line0.00- DD+1.23
- DX+2.00
- OX−1.30
- EV−1.93
Running tally after this possession- Score
- 6–0 ORE–TTU
- OD + DD
- −2.4 Drive net
- OX + DX
- +6.0 Exchange net
- SP
- +2.3 Special teams
- EV
- 0.0 Extra possession
166–0 - 1713–0Oregon · OffenseTouchdownStarting field positionTTU 6Texas Tech’s 6 · 6 yards to the end zone1 play · 6 yards
Noah Whittington scores on the first snap
Estimated Oregon value on this line+7.00- OD+2.30
- DX+2.70
- XP+0.07
- EV+1.93
Running tally after this possession- Score
- 13–0 ORE–TTU
- OD + DD
- −0.1 Drive net
- OX + DX
- +8.8 Exchange net
- SP
- +2.4 Special teams
- EV
- +1.9 Extra possession
- Texas Tech · OffenseDownsStarting field positionTTU 8Texas Tech’s own 8 · 92 yards to the Oregon goal12 plays · 57 yards
Oregon holds at its own 35
Estimated Oregon value on this line0.00- DD+0.55
- DX+0.90
- K+0.48
- EV−1.93
Running tally after this possession- Score
- 13–0 ORE–TTU
- OD + DD
- +0.5 Drive net
- OX + DX
- +9.7 Exchange net
- SP
- +2.9 Special teams
- EV
- 0.0 Extra possession
1813–0 - 1913–0Oregon · OffenseInterceptionStarting field positionORE 35Oregon’s own 35 · 65 yards to the Texas Tech goal7 plays · 19 yards
Texas Tech takes over at its own 45
Estimated Oregon value on this line0.00- OD−2.18
- DX+0.25
- EV+1.93
Running tally after this possession- Score
- 13–0 ORE–TTU
- OD + DD
- −1.7 Drive net
- OX + DX
- +9.9 Exchange net
- SP
- +2.9 Special teams
- EV
- +1.9 Extra possession
- Texas Tech · OffenseInterceptionStarting field positionTTU 45Texas Tech’s own 45 · 55 yards to the Oregon goal10 plays · 46 yards
Oregon intercepts at the goal line; touchback
Estimated Oregon value on this line0.00- DD+3.48
- DX+1.40
- OX−2.95
- EV−1.93
Running tally after this possession- Score
- 13–0 ORE–TTU
- OD + DD
- +1.8 Drive net
- OX + DX
- +8.4 Exchange net
- SP
- +2.9 Special teams
- EV
- 0.0 Extra possession
2013–0 - 2116–0Oregon · OffenseField goalStarting field positionORE 20Oregon’s own 20 · 80 yards to the Texas Tech goal10 plays · 55 yards
Sappington makes from 43 yards
Estimated Oregon value on this line+3.00- OD−0.27
- DX+0.80
- FG+0.54
- EV+1.93
Running tally after this possession- Score
- 16–0 ORE–TTU
- OD + DD
- +1.5 Drive net
- OX + DX
- +9.2 Exchange net
- SP
- +3.4 Special teams
- EV
- +1.9 Extra possession
- Texas Tech · OffenseDownsStarting field positionTTU 25Texas Tech’s own 25 · 75 yards to the Oregon goal4 plays · 0 yards
Oregon takes over at the Texas Tech 25
Estimated Oregon value on this line0.00- DD+0.93
- DX+1.00
- EV−1.93
Running tally after this possession- Score
- 16–0 ORE–TTU
- OD + DD
- +2.5 Drive net
- OX + DX
- +10.2 Exchange net
- SP
- +3.4 Special teams
- EV
- 0.0 Extra possession
2216–0 - 2316–0Oregon · OffenseMissed field goalStarting field positionTTU 25Texas Tech’s 25 · 25 yards to the end zone4 plays · 7 yards
Oregon misses from 36 yards
Estimated Oregon value on this line0.00- OD−2.73
- DX+1.05
- FG−0.25
- EV+1.93
Running tally after this possession- Score
- 16–0 ORE–TTU
- OD + DD
- −0.3 Drive net
- OX + DX
- +11.2 Exchange net
- SP
- +3.1 Special teams
- EV
- +1.9 Extra possession
- Texas Tech · OffenseDownsStarting field positionTTU 20Texas Tech’s own 20 · 80 yards to the Oregon goal6 plays · 8 yards
Oregon takes over at the Texas Tech 28
Estimated Oregon value on this line0.00- DD+2.08
- DX+0.99
- OX−1.14
- EV−1.93
Running tally after this possession- Score
- 16–0 ORE–TTU
- OD + DD
- +1.8 Drive net
- OX + DX
- +11.1 Exchange net
- SP
- +3.1 Special teams
- EV
- 0.0 Extra possession
2416–0 - 2523–0Oregon · OffenseTouchdownStarting field positionTTU 28Texas Tech’s 28 · 28 yards to the end zone8 plays · 27 yards
Oregon turns the final short field into seven
Estimated Oregon value on this line+7.00- OD+4.02
- DX+0.98
- XP+0.07
- EV+1.93
Running tally after this possession- Score
- 23–0 ORE–TTU
- OD + DD
- +5.8 Drive net
- OX + DX
- +12.0 Exchange net
- SP
- +3.2 Special teams
- EV
- +1.9 Extra possession
Summing up why +36.1 and −18.3 make a better game summary.
Oregon’s offense scored every point, but the defense repeatedly determined where those possessions began. Takeaways gave Oregon the ball at the Texas Tech 33, 29, and 6. Two late fourth-down stops produced starts at the Texas Tech 25 and 28.
The offense had real successes: three made field goals, a 55-yard field-goal drive, and two touchdowns. But it also failed on fourth down three times, threw an interception, missed a field goal, and punted after taking over at the Texas Tech 33. Its drives lost 12.6 points of margin (OD), and its possession exchanges lost another 5.7 (OX).
By contrast, Oregon’s defense forced four turnovers, produced three more fourth-down stops, and shut out an offense that had entered the game averaging 42.5 points.
That defense created +18.4 points of margin by ending Texas Tech’s drives without points (DD), and another +17.7 through takeaways and possession changes (DX). Special teams added 3.2, and Oregon’s unmatched possession added 1.9. That is the game the scoreboard could not assign on its own.
From one game to every game
Now that you understand one game, you can read the Game Splits page.
Oregon–Texas Tech showed the accounting in motion. On BCF Toys, those same credits and debits are compressed into one row for every game. The row adds up the possession-by-possession story you just followed; it does not introduce a different model.
Begin with Final, N Final, and NM to learn which margin the row is explaining. Then read OV, DV, and SV to see which unit created it. Only after that should you unfold the drive and exchange columns to understand how. The four passes below turn a dense table back into a football game.
- 1
Compare Final with N Final to see whether garbage possessions changed the score.
- 2
Check that NM is the margin in N Final and note how many possessions, NP, produced it.
- 3
Jump to OV, DV, and SV. Those are the offense, defense, and special-teams answers.
- 4
Unfold the winning or losing unit into OD/OX, DD/DX, or the four special-teams columns.
| Column | Read it as | ORE–TTU |
|---|---|---|
| Final | The scoreboard at the end of the game | 23–0 |
| N Final | The score when the last non-garbage possession ended | 23–0 |
| NM | The scoring margin on the counted, competitive possessions | +23 |
| NP | Number of counted possessions | 25 |
| OD / OX | What the offense did during its drives / what it left behind when possession changed | −12.6 / −5.7 |
| DD / DX | What the defense stopped during drives / what its takeaways and stops handed to the offense | +18.4 / +17.7 |
| FG / P / K / XP | Value from field goals, punts, kickoffs and point-after plays | +1.8 / +0.8 / +0.5 / +0.1 |
| EV | The own-25 baseline for an unmatched extra possession | +1.9 |
| OV / DV / SV | The grouped offense, defense and special-teams totals | −18.3 / +36.1 / +3.2 |
Who created the margin?
These are unadjusted, point-valued contributions from the game as it happened.
Open the 2025 Game Splits ↗How good was the performance?
GR, OGR, DGR, and SGR put per-possession performance in opponent-adjusted, neutral-field context.
Open the 2025 Game Ratings ↗How good is the team?
The season ratings aggregate and opponent-adjust possession efficiency to estimate team and unit strength.
Open the 2025 FEI ratings ↗The next game
Watch the next game differently.
The value of this perspective comes from understanding how each unit works together. The phrase “complementary football” is in vogue, but now you have a framework for really understanding what that means.
On the next Saturday, when an offense scores after taking over at the opponent’s 20, ask who created the field position. When a defense allows a field goal after a turnover, do not judge it as if the opponent drove the length of the field. Notice the punt that changes the assignment, the kickoff that concedes ten yards, and the fourth-down stop that gives the offense an opportunity. The game is a sequence of inherited situations, not two isolated units taking turns.
Afterward, open the Game Splits page before the box score hardens into the story you repeat. Start with the offense, defense, and special-teams totals. Then unfold the unit that surprised you. Over a season, those game-level contributions become a better way to understand which teams are actually strong and what might happen next.
I had spent almost forty years playing, coaching, watching, and analyzing football before these numbers changed the way I saw it. The speed, violence, and highlights remained just as thrilling, while the numbers made me more precise about who created them. At the beginning of this article, I wrote that what gets counted counts. That is the point: better counting produces a better football story.
Sources and method
What this draft uses.
The exact game-level unit values come from Brian Fremeau’s 2025 Game Splits and Drive Totals. Definitions come from his glossary, data notes, and possession-flow explainer. The 25 counted drives are reconstructed from the official play-by-play. BCF does not publish a 2025 possession-level value table, so the values on the individual cards are estimates constrained to sum to the exact published OD, OX, DD, DX, FG, P, K, XP, and EV totals.